share
Genealogy & Family HistoryIntra Family marriage / rejoining family trees?
[+22] [3] Jamie McNaught
[2012-12-10 13:55:23]
[ software-recommendations family-tree ]
[ https://genealogy.stackexchange.com/questions/2587/intra-family-marriage-rejoining-family-trees ]

Deep in my families history (1600's or there abouts) our family split in two. About three or four generations later two distant cousins got married creating a split / rejoin.

              G.G.G.Parents A
       +---------+---------------------------+
    G.G.Grand Parent                      G.G.Grand Parent
       |                                     |
    G.Grand Parent                        G.Grand Parent
       |                                     |
    Grand Parent                          Grand Parent
       |                                     |
+------+-------+                     +-------+-------+
Aunt       Parent A - - -+- - - Parent B         Uncle
                         |
                  +------+------+
               Child A        Child B
                 ...           ...

So in this small example, the family splits in two at G.G.Grandparents and then rejoins later when Parent A and Parent B marry.

About 8 years ago I tried to find a software package which could model this and failed. Has anything happened in the intervening time?

Sorry I'm just asking in SE without doing much research, but I spent a lot of effort last time without any success and I am sure there is someone out there who can point me to an excellent package!


@ColeValleyGirl: I'm looking for a piece of software that is able to print out such a tree/DAG (thanks @ACProctor) in high enough quality to display/frame. All software I tried before didn't seem to be able to display this as they seemed to support mainly variations of Ancestors / Descendants rather than an output of all the people that had been inputed.

@AdrianB38: Essentially, I want to see "everyone". The tree I have was put together by my grandfather, who probably had a lot more data/people, but I've only got the hand written tree which highlights this split. It's essentially a tree of my grandparents ancestors (including this split which is joined at a common ancestor) and descendants (me + my family). I'd like to reproduce this in the computer (there is about 400 years - hundreds of people).

@AdrianB38: Re your point about generations, yes, I have that issue. I think it's only one generation, might be two - i've not looked at the tree in a while. The split between families happened over about 150-200 years iirc.

I can write an SVG generator if I really need to (I'm a Software Engineer) albeit I'm aware such a "loop"/"dependency" is painful to program for, but I was hoping that there was something which could handle this.

(2) Hello, Jamie, and welcome to GSE. Could you explain a little more about what you're looking for -- is it a software package that will allow you to correctly record the relationships you describe (which most should do) or one that will present the relationships in a particular way? - user104
This is only a comment because it doesn't answer your question but it may have some educational value to readers. Depiction of lineage is technically not a "tree", despite the widespread usage of the term "family tree". It is less than a generalised "network" though. In fact, the proper term is a Directed Acyclic Graph (DAG, en.wikipedia.org/wiki/Directed_acyclic_graph) and the main characteristic is that there are no loops. In our field, that means you cannot be your own ancestor in any way. - ACProctor
(3) You really need to work out what it was that you wanted to see previously but couldn't. E.g. if you want to see a diagram like the one that you show, then you won't ever see it on a simple Ancestors Tree or Descendants Tree because they only ever go out, never come back in. So in that case you need to look for different sorts of diagrams, which might be called things like All-Relatives or Everyone. But be aware that what you have drawn is the simplest case and if a program is written to draw such a tree, it may add on things to help to navigate that you don't want in your simple case. - AdrianB38
(3) A simple extension to complicate matters is to imagine what happens if Parent A comes from a line that's squeezed an extra generation in. Then the couple at the top of the tree are 3G GPs of child A when looked at via parent B but 4G GPs of child A when looked at via parent A. Some people think that their program is wrong when it describes the same couple as both 4GGP and 3GGP - no, it's real life and it really is that complicated! And drawing such a tree (with the extra generation on one route) gets a real pain, not least because we tend to want all people on one generation lined up. - AdrianB38
Thanks everyone, I've added additional details to the question. I'd upvote you all but I don't seem to have that privilege on this SE yet! - Jamie McNaught
(1) Before modern times the "average marriage" was between third cousins. This underscores Tony's comments that ancestry structures are DAGs, not trees. "Ancestor collapse" is another term used for this concept. Many ahnentafel outputs will put "same as" in the lines where ancestor collapse occurs rather than duplicate the information. Decent software deals with the true DAG-nature of ancestry. "Register" format and other reports should be able to deal with ancestor collapse. The system I use manages this fine. - Tom Wetmore
I just tried my software (FamilyHistorian) on my collapsed ancestors in an "All Relatives". The diagram is not simple even when restricted to my ancestors plus siblings. In essence it shows A marrying B on one "sub-tree" and B marrying A on another - i.e. 2 such marriages. Then just one of those marriages has children shown while the other has a ribbon to connect it with the children, i.e. the join is made below where you have it. While one can say - "But this tree would be simpler if...", the software has to cope with all possibilities. - AdrianB38
(2) To be honest, if the "tree" were to be produced as a 1-off, I'd consider using a diagramming tool such as Visio or whatever.... If you were to put lots of people into some genealogical software that could produce an All Relatives that allowed boxes to be reordered across and pulled down out of their generations, you might still be there a year later, trying to get a decent ordering of your real data. Like I say - it's easy to draw the principle but real life tends to be that bit more complex! - AdrianB38
@AdrianB38 Yes, I was considering using a diagram tool. Just seems a bit 'dirty'. I mean, surely there is a tool already which can do this? - Jamie McNaught
The tools exist to draw such collapses of ancestry (e.g. FamilyHistorian's All Relatives diag) but as they need to cope with anything, they may not give as simple a "tree" as your original text shows. Not sure but I think I remember seeing genealogy software that did just diagram production - but can't remember what it was. Maybe you could shuffle the boxes round to produce an optimum structure in those pgms. - AdrianB38
[+9] [2012-12-10 17:35:21] GeneJ

Jamie asks for assistance dealing with duplicates that result from family intermarriages.

There are two notions at work (note 1):

  • Recognize that each person in your family tree is a unique individual--you do not want to duplicate identities about any of those persons.

  • Report the ancestry of each person consistent with the information you have developed. Each person in your family tree has a particular ancestry; you want to report about that ancestry.

In the chapter, "Basic Systems," Joan Ferris Curran CG, refers to this "one too many" circumstance as "multiple lines of descent." (note 2) That is to say, someone descends of the same person in more than one way!

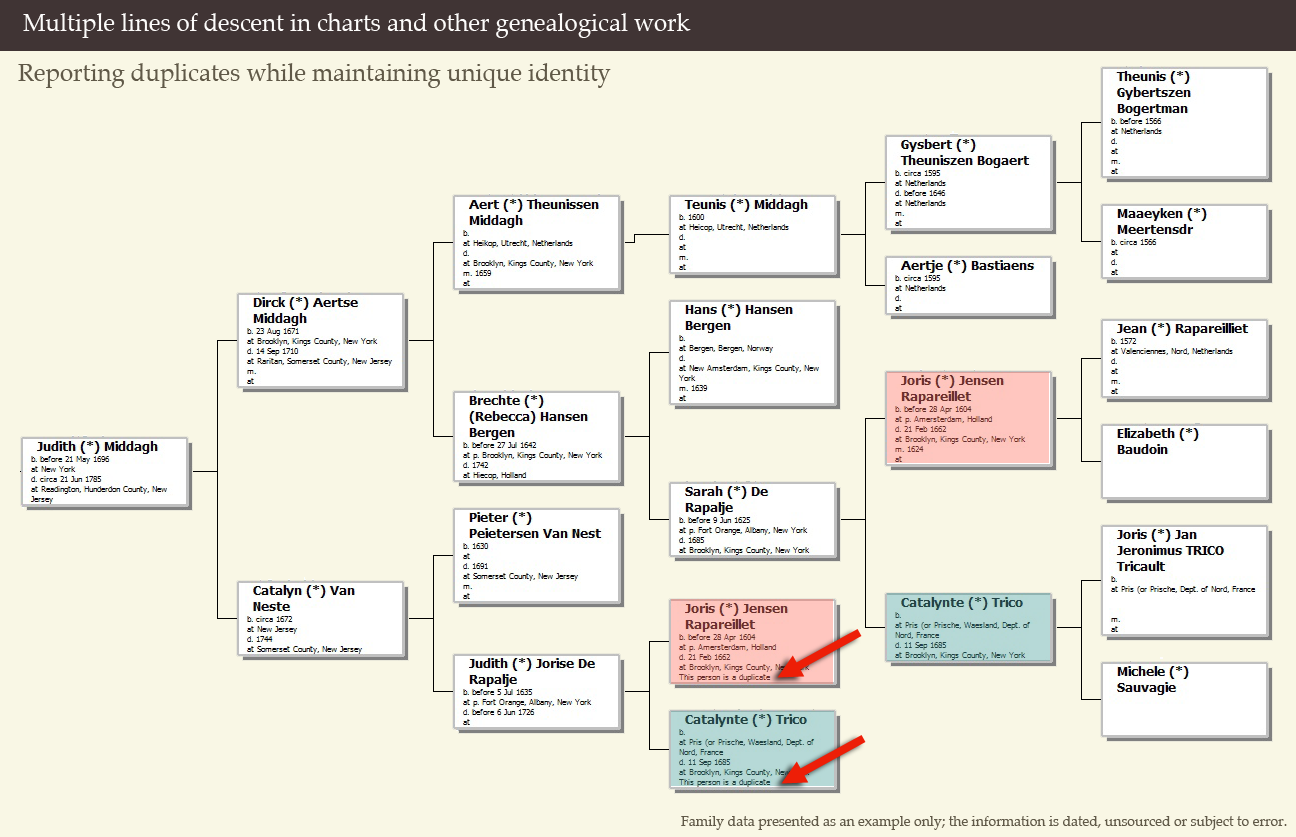
While it might seem that these intermarriage conflict with notions of unique identity and unique ancestry, there are well documented solutions. The chart below is an example of a solution to the problem.

In this example (note 3) Judith Middaugh's parents are related. Both descend of the marriage between Joris Rapareillet and Catalynte Trico. Judith's father, Dirck Middaugh, is the great-grandson of Joris and Catalynte; Judith's mother is the granddaughter of the same couple.

The chart presents the solution to this challenge. It identifies each of the two entries about Joris Rapareillet and Catalynte Trico, one (of each) is marked "duplicate." The key here is that the reader is always referred to the primary entry for a complete and continuing information about Joris and Catalynte.

In this chart, the identification is made via names, dates and places. That identification could just as easily have been made by a reference number, graphic, etc. The important part is to make sure the unique identification is clear so that one entry (if you will, the primary entry) provides the complete and continuing information.

enter image description here

Jamie asks what software supports solutions.

Many software programs provide support for weeding out multiple lines of descent.

The information in the example/chart was printed from the software program, The Master Genealogist (v8), which I happened to have installed right now. (note 4) Were it not for a little computer glitch, I'd have posted more about support provided by other software programs.

So many of the vendors offer free trials or free versions today. If it has been a few years since you've taken a look, why not take several of them out for a spin?

Jamie clarifies and comments, "I am actually looking for software [that provides the reporting of duplicates (rather than weeds them out)]."

Beauty really is in the eye of the beholder! I've just sent a note to a genealogy charting engineer/expert, referring him to the question.


Notes and References:

  1. For the importance of unique identity and ancestry, see the Board for Certification of Genealogists, BCG Genealogical Standards Manual (2000).
  2. Joan F. Curran, Madilyn C. Crane, and John H. Wray, edited by Elizabeth Shown Mills, Numbering Your Genealogy: Basic Systems, Complex Families, and International Kin [1], rev. ed. (Washington: National Genealogical Society, 2008).
  3. The family data in the chart is presented as an example only. The data/information is old, unsourced or subject to error.
  4. For the purpose of this presentation, I annotated the printed chart by adding the color overlay and arrows.
[1] http://www.ngsgenealogy.org/cs/publications/ngs_special_publications/current_publications

(1) Thanks @GeneJ, very informative. I am actually looking for software which will enable the join to be printed out, rather than identifying one of the duplciates and excluding it from further ancestors / decendants. So in your example above, there would be only one instance of Joris and Catalynte and the software would "cope" with layout etc. I understand this is not simple, particularly if there are multiple of such joins (although in my family there is only one!). - Jamie McNaught
As for why I've not installed trials etc, it's simply a matter of best use of time. I'd rather consult with experts such as yourself and contribute a useful answer to the community. And if my experience last time is anything to go by, this will use less of my time and be more useful to the world at large! - Jamie McNaught
@JamieMcNaught I'll update my answer to put the graphic and solution in better context for this more insightful information; but I don't plan on expanding my answer. Have sent a note to a charting software design expert; don't know if he will have time to chime in or not. - GeneJ
1
[+5] [2012-12-11 14:49:17] Sue Adams

I often want to present such splits and joins in a family tree in chart form, because the visual representation is easy to understand. It is possible to produce such a chart using genealogy software, but not without 'cheating'. The chart below was created in Family Tree Maker 10 to support a discussion of how property was passed down to the highlighted couple(1st cousins): Chart illustrating Tyrrell family relationships

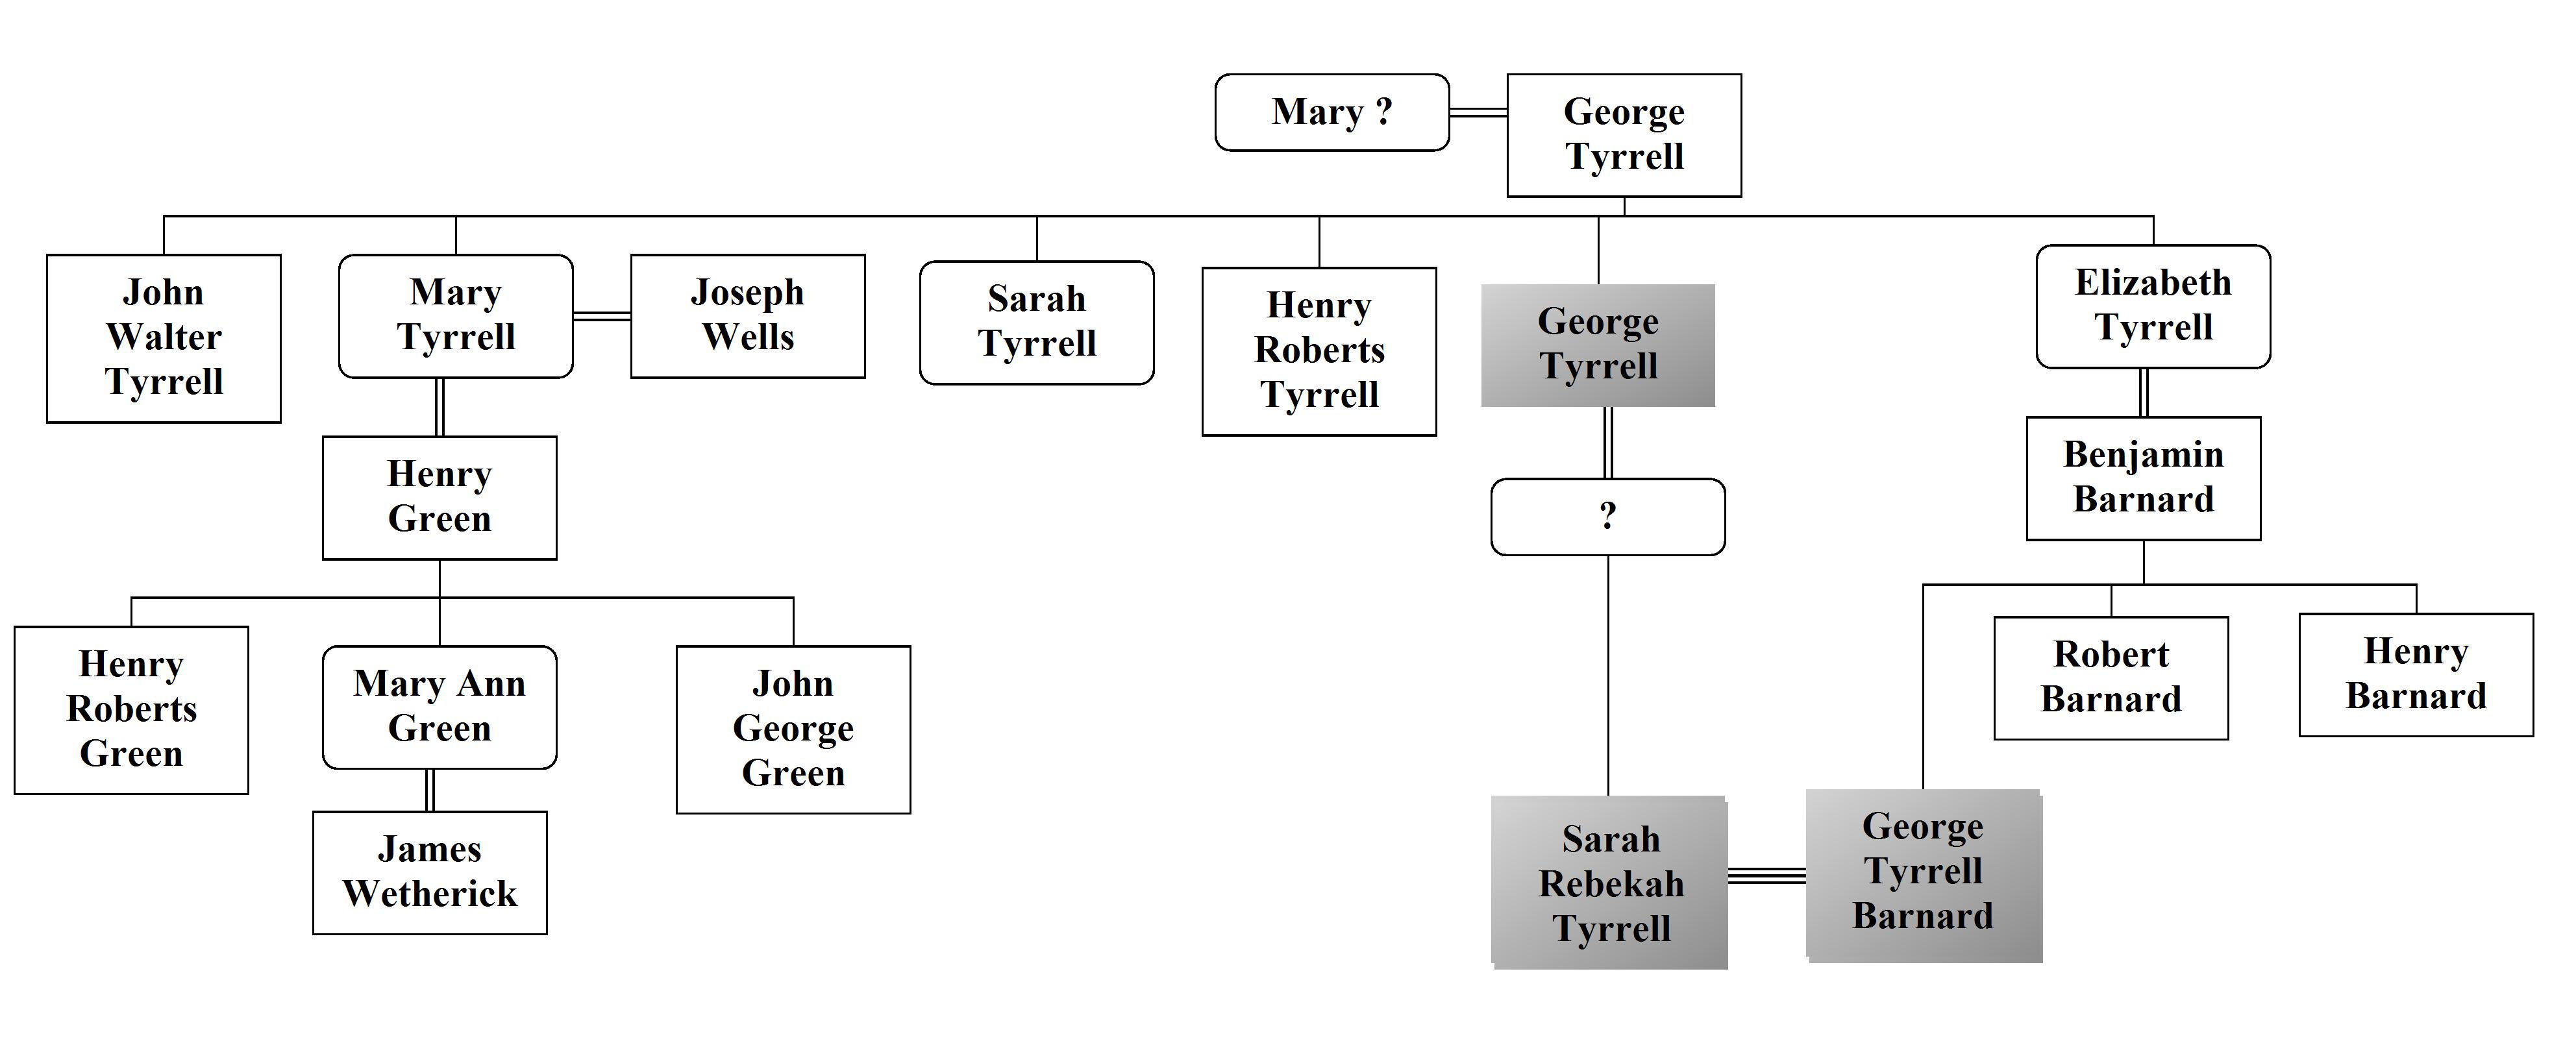
It is a two step process:

1) Select people of interest. FTM allows removal of people from a chart, but if the database is large, it is quicker to export a subset to a new database.

2) Modify chart by dragging duplicate people so that the boxes are overlaid. FTM allows the repositioning of boxes.

Both steps are a fiddle and may defeat less tech savy users. Other software has similar tools. A chart option that highlights a particular cousin marriage and overlays the boxes automatically would be a valuable feature, but I have not seen it implemented in any software.


2
[+3] [2012-12-11 05:46:09] Gene Golovchinsky

If software development is an attractive option, I think it should be straightforward to create a graph visualization in something like d3. I wouldn't advocate building any tools that require data entry, but it wouldn't be hard to parse a GEDCOM file of your family DAG & create a visual representation. Adapting some variation of this example might be a place to start.


(1) Gene: Once you get more than 1 or 2 of these "rejoins", then the lines begin to cross and things get very messy. - lkessler
True, but how many such anomalies would a normal tree have? I've encountered one related case in my trees (over 1000 people) where two families married into each other at different times. - Gene Golovchinsky
(3) @Gene, if you're investigating a community (as my partner is) rather than a single lineage, you get an awful lot on such 'anomalies.' - user104
@Gene, I'm hoping it wont come to writing something to parse a GEDCOM file and do the visualisation part. I'm hoping there is a piece of software out there that can atleast cope with my simply situation. Cheers for the tip with d3, that's very interesting. - Jamie McNaught
@ColeValleyGirl Good point! but then from a visualization perspective, are you interested in the forest or the trees? (so to speak) - Gene Golovchinsky
@GeneGolovchinsky, both at different times, but the visualisation is so complicated that it usually isn't worth it. - user104
@ColeValleyGirl My professional opinion is that visualizations needs to be tailored to specific needs or use cases; a single visualization that is appropriate to answer all questions about a data set is rarely observed in practice. - Gene Golovchinsky
If software development is the selected route then I would stress the difference between the internal linkages (which are described via a DAG) and the presentation. You can still give the appearance of a tree (which is simpler to layout and to conceptualise) but taking data from a DAG structure. It merely needs some indication that a particular entity is visible in more than one place - something for which there are zillions of possible solutions. Some of the other responses here allude to the same possibility. Maybe you could sell this back to us one day when you've finished it ;-) - ACProctor
3